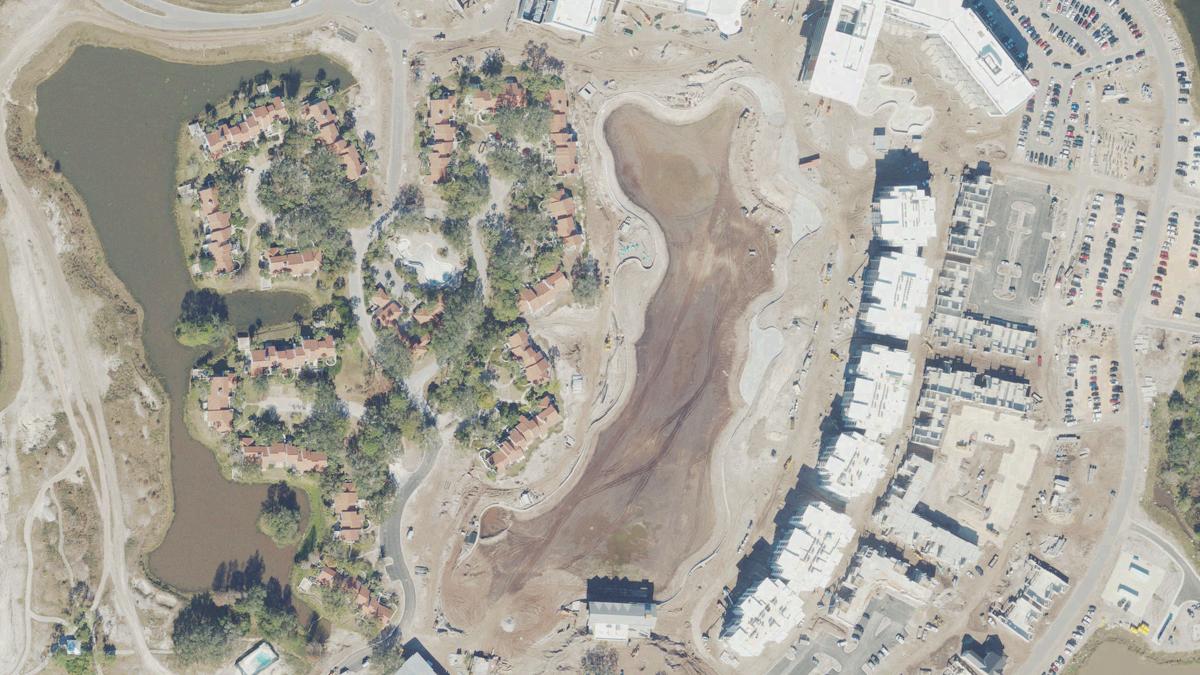
West Beach
Lake beach in Florida, 0.4 mi of shoreline, with parking and restaurants within walking distance.
- Restaurants and bars
- Hotels nearby
- HoursNot on file
- Parking1 lot within 1,310 ft
- DirectionsGoogle Maps
- Sunset
- 7:36 pmover land
- Parking
- Mapped1 within 1,310 ft
- Families
- Limited
Today, Thursday, Sep 10
Good beach day
36% rain chance · wind.
- High
- 89 F
- Wind
- 2 mphup to 14 mph
- Rain chance
- 36%
- UV index
- 8high
- Sun
- 7:08 am to 7:36 pm
- 8:00 am · best77 Fovercast, 0% rain, 3 mph
- 11:00 am85 Fovercast, 3% rain, 4 mph
- 2:00 pm89 Fmostly clear, 8% rain, 1 mph
- 5:00 pm86 Fpartly cloudy, 30% rain, 14 mph
Great for
- FamiliesLimitedNo bathrooms mapped, parking nearby
- ConvenienceGood1 parking lot, 1 places to eat
How the Beach Score is calculated: 4.3 of 10
The score is the sum of the components below. Clear water counts only where a clarity source exists. Rankings never take revenue as an input.
| Component | Points | Fact |
|---|---|---|
| Facilities | 1.8 of 3 | Within walking distance: parking, restaurants. |
Ranks #33 of 37 for beachfront hotels in Florida, #50 of 60 for hotels nearby in Florida, #63 of 67 for restaurants and bars in Florida, #103 of 124 for parking in Florida. All beaches in Florida.
Amenities
- Parking1 nearby
- Free parkingNo
- BathroomsNo
- ShowersNo
- Restaurants and bars1 nearby
- Beachfront hotels1 nearby
- Hotels nearby1 nearby
- Beachfront campingNo
- Camping nearbyNo
- PierNo
- BoardwalkNo
Hours, fees, and rules
Hours and fees are not on file yet. No operator page found yet.
- Address
- Brood Court, Orange County, FL 32836
Planning a trip
Early October is usually warm, with a higher chance of a rainy day.
- High
- 83 FWarm
- Rainy day
- 39%Rain is common
What to expect
- Rainy days are common in October (10 a month)
- October is within Atlantic hurricane season, at its peak
Atlantic hurricane season runs June 1 to November 30, peak from mid-August to late October. Storm history near this beach
1 October storm within 62.1 mi since 1980, about one every 46 years, 1 at hurricane strength. Most recent in any month: Hurricane Milton, October 2024, 25.3 mi away. Source: NOAA HURDAT2 best tracks, counted at tropical storm strength or stronger. Season dates from the NOAA National Hurricane Center.
West Beach through the year
| Measure | ||||||||||||
|---|---|---|---|---|---|---|---|---|---|---|---|---|
| Warm water | no data | no data | no data | no data | no data | no data | no data | no data | no data | no data | no data | no data |
| Low rain | Jan: 8 rainy days | Feb: 6 rainy days | Mar: 8 rainy days | Apr: 9 rainy days | May: 14 rainy days | Jun: 22 rainy days | Jul: 26 rainy days | Aug: 25 rainy days | Sep: 22 rainy days | Oct: 10 rainy days | Nov: 5 rainy days | Dec: 5 rainy days |
| Calm water | no data | no data | no data | no data | no data | no data | no data | no data | no data | no data | no data | no data |
When to go
- Best overallNovemberfewer rainy days · warm days
- DriestNovember to December5 rainy days a month
All monthly averages, 2023-2025
| Month | Sea temp | Air max | Rain days | Wave height |
|---|---|---|---|---|
| Jan | n/a | 69 F (20 C) | 8 | n/a |
| Feb | n/a | 76 F (24 C) | 6 | n/a |
| Mar | n/a | 80 F (27 C) | 8 | n/a |
| Apr | n/a | 84 F (29 C) | 9 | n/a |
| May | n/a | 89 F (31 C) | 14 | n/a |
| Jun | n/a | 89 F (32 C) | 22 | n/a |
| Jul | n/a | 90 F (32 C) | 26 | n/a |
| Aug | n/a | 90 F (32 C) | 25 | n/a |
| Sep | n/a | 87 F (31 C) | 22 | n/a |
| Oct | n/a | 82 F (28 C) | 10 | n/a |
| Nov | n/a | 77 F (25 C) | 5 | n/a |
| Dec | n/a | 72 F (22 C) | 5 | n/a |
Explore West Beach
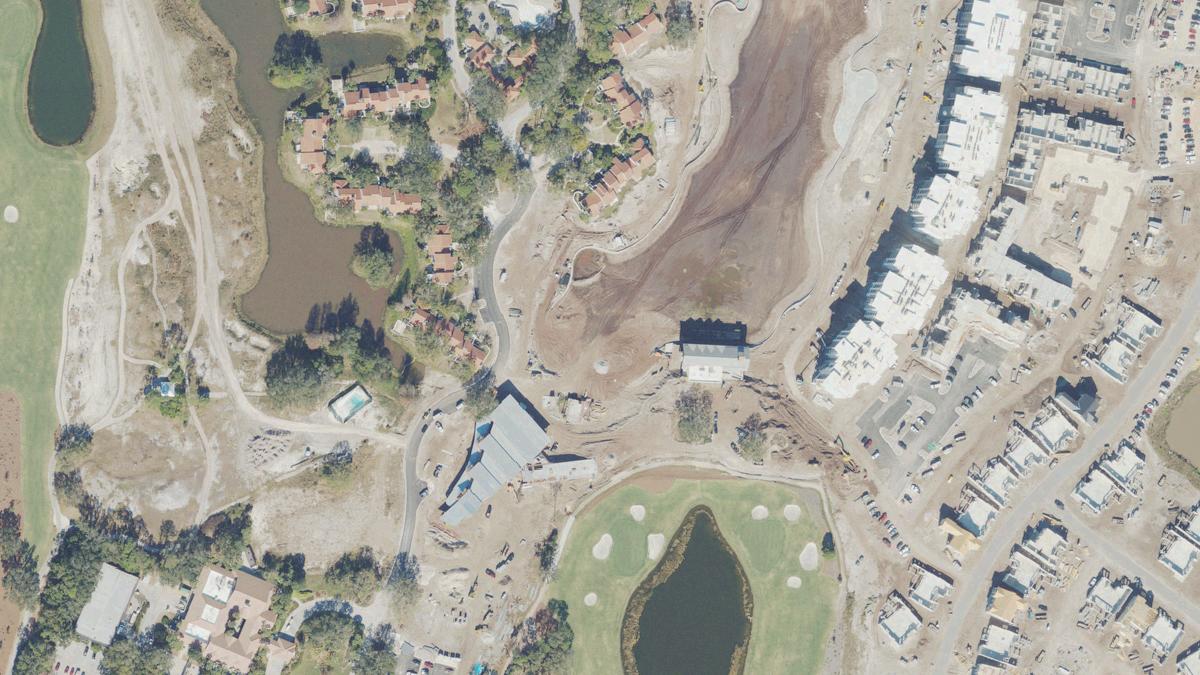
Parking, food, stays, and facilities around the beach, mapped in OpenStreetMap within 0.7 mi.
All places near West Beach as a list (10)
Nearest parking 1,330 ft · 5 min walk · Nearest food and drinks 490 ft · 2 min walk
Nearby beaches
Questions about West Beach
Is there parking at West Beach?
Yes. 1 mapped parking area within 1,310 ft. Source: OpenStreetMap.
When is hurricane season at West Beach?
Atlantic hurricane season runs June 1 to November 30, with the peak from mid-August to late October, per the NOAA National Hurricane Center. Since 1980, 17 named storms passed within 62.1 mi of the beach, 8 at hurricane strength, most in August, September and November. Source: NOAA HURDAT2 best tracks.
Sources
- © OpenStreetMap contributors
- Weather data by Open-Meteo.com
- Storm tracks from the NOAA National Hurricane Center HURDAT2 archive, public domain
Licenses and refresh dates for every dataset are on the data page. Something wrong? Every beach page has a report button; corrections are logged with a date.
© OpenStreetMap contributors. Beach location, shoreline, and amenity positions are from OpenStreetMap under the ODbL. Data updated Sep 10, 2026.