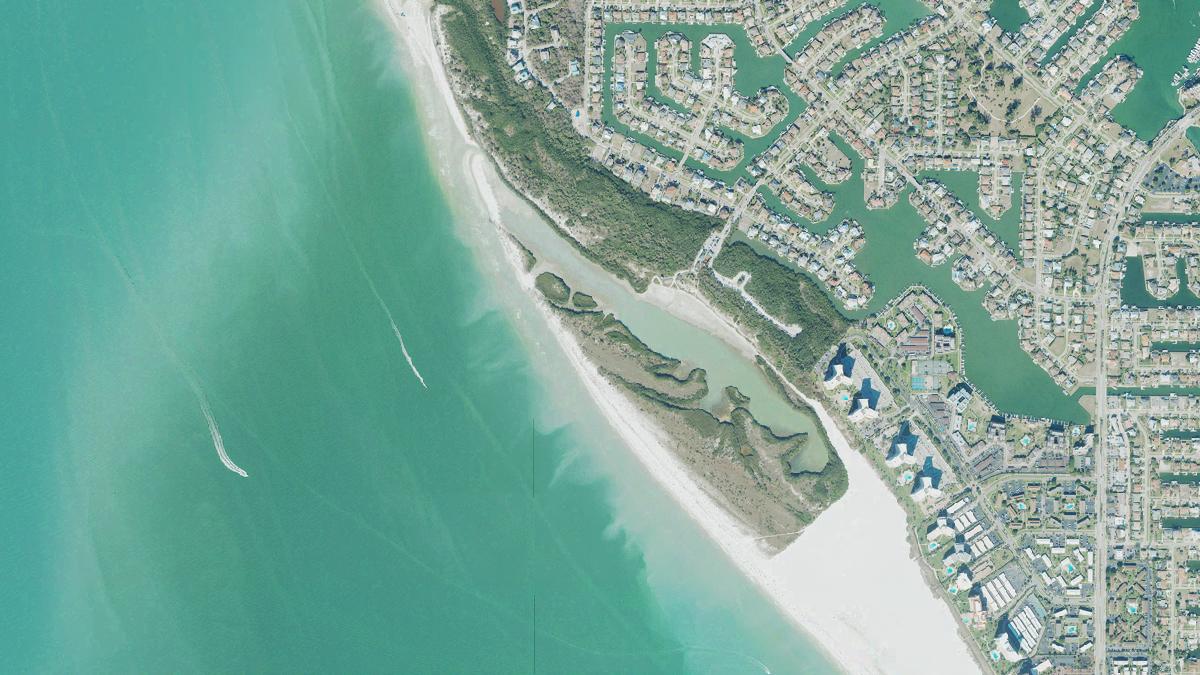
Sand Dollar Spit Beach and Landing
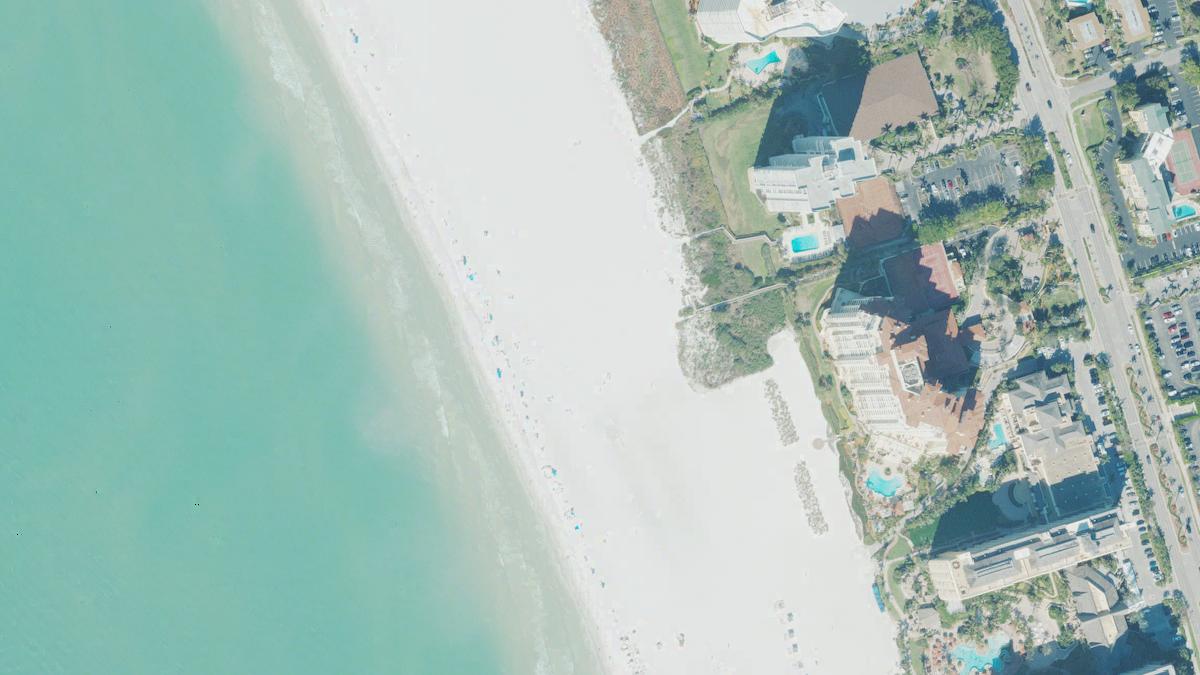
Ocean beach in Marco Island, facing north-east, with parking within walking distance.
- Calm water 8.6
- Warm water 7.4
- HoursNot on file
- Parking2 lots within 1,310 ft
- DirectionsGoogle Maps
- Calm water
- 8.6 of 10
- Water
- 89 Ftoday
- Sunset
- 7:36 pmover land
- Parking
- Mapped2 within 1,310 ft
- Families
- Fair
Today, Thursday, Sep 10
Good beach day
Calm water · very warm water · light wind. Watch: 26% rain chance.
- High
- 93 F
- Sea temperature
- 89 F
- Waves
- 0.5 ftup to 0.8 ft
- Wind
- 6 mphup to 12 mph
- Rain chance
- 26%
- UV index
- 7high
- Sun
- 7:10 am to 7:36 pm
- High12:57 am3.1 ft
- Low6:40 am0.9 ft
- High12:48 pm3.4 ft
- Low7:11 pm0.4 ft
- 8:00 am · best77 Fclear, 3% rain, 6 mph
- 11:00 am89 Fpartly cloudy, 13% rain, 8 mph
- 2:00 pm92 Fovercast, 16% rain, 11 mph
- 5:00 pm88 Fovercast, 26% rain, 3 mph
Great for
- FamiliesFairCalm water 8.6, no bathrooms mapped
- SwimmingVery goodWaves around 1.5 ft, sea 80 F on average
- SunsetsLimitedsets over land
- ConvenienceLimited2 parking lots, no food mapped
How the Beach Score is calculated: 4.5 of 10
The score is the sum of the components below. Clear water counts only where a clarity source exists. Rankings never take revenue as an input.
| Component | Points | Fact |
|---|---|---|
| Facilities | 1.0 of 3 | Within walking distance: parking. |
| Calm water | 1.7 of 2 | Mean daily maximum wave 1.5 ft. |
| Warm water | 0.7 of 1 | Mean sea temperature 80 F. |
| Sunset over water | 0.0 of 1 | The shore faces away from the sunset all year. |
Ranks #31 of 46 for calm water in Florida, #59 of 168 for warm water in Florida, #93 of 124 for parking in Florida. All beaches in Florida.
Amenities
- Parking2 nearby
- Free parkingNo
- BathroomsNo
- ShowersNo
- Restaurants and barsNo
- Beachfront hotelsNo
- Hotels nearbyNo
- Beachfront campingNo
- Camping nearbyNo
- PierNo
- BoardwalkNo
Water, sand, and nature
- Calm water8.6 of 10
- Warm water7.4 of 10
Hours, fees, and rules
Hours and fees are not on file yet. No operator page found yet.
- Address
- Spinnaker Drive, Marco Island, FL 34145
Sunset and sunrise
The shore faces north-east (28 degrees). The sun sets over land all year.
Planning a trip
Early October is usually hot, with very warm water and a higher chance of a rainy day.
- Water
- 83 FVery warm
- High
- 85 FHot
- Rainy day
- 43%Rain is common
- Waves
- 1.6 ftModerate
What to expect
- Very warm swimming water, around 83 F
- Moderate waves, around 1.6 ft
- Rainy days are common in October (12 a month)
- October is within Atlantic hurricane season, at its peak
Atlantic hurricane season runs June 1 to November 30, peak from mid-August to late October. Storm history near this beach
3 October storms within 62.1 mi since 1980, about one every 15 years, 2 at hurricane strength. Most recent in any month: Hurricane Ian, September 2022, 55.5 mi away. Source: NOAA HURDAT2 best tracks, counted at tropical storm strength or stronger. Season dates from the NOAA National Hurricane Center.
Sand Dollar Spit Beach and Landing through the year
| Measure | ||||||||||||
|---|---|---|---|---|---|---|---|---|---|---|---|---|
| Warm water | Jan: 67 F, cool | Feb: 71 F, mild | Mar: 75 F, mild | Apr: 78 F, warm | May: 84 F, very warm | Jun: 86 F, very warm | Jul: 89 F, very warm | Aug: 89 F, very warm | Sep: 87 F, very warm | Oct: 82 F, very warm | Nov: 76 F, warm | Dec: 70 F, mild |
| Low rain | Jan: 7 rainy days | Feb: 6 rainy days | Mar: 8 rainy days | Apr: 9 rainy days | May: 12 rainy days | Jun: 21 rainy days | Jul: 25 rainy days | Aug: 25 rainy days | Sep: 21 rainy days | Oct: 12 rainy days | Nov: 5 rainy days | Dec: 6 rainy days |
| Calm water | Jan: waves 1.9 ft, moderate | Feb: waves 1.6 ft, moderate | Mar: waves 1.9 ft, moderate | Apr: waves 1.8 ft, moderate | May: waves 1.2 ft, usually calm | Jun: waves 1.4 ft, usually calm | Jul: waves 0.9 ft, usually calm | Aug: waves 1.3 ft, usually calm | Sep: waves 1.3 ft, usually calm | Oct: waves 1.7 ft, moderate | Nov: waves 1.5 ft, usually calm | Dec: waves 1.6 ft, usually calm |
When to go
- Best overallOctober to Decemberwarm water · fewer rainy days · calm water · warm days
- Warmest waterJuly to September89 F average
- DriestNovember to December5 to 6 rainy days a month
All monthly averages, 2023-2025
| Month | Sea temp | Air max | Rain days | Wave height |
|---|---|---|---|---|
| Jan | 67 F (20 C) | 72 F (22 C) | 7 | 1.9 ft |
| Feb | 71 F (22 C) | 76 F (25 C) | 6 | 1.6 ft |
| Mar | 75 F (24 C) | 79 F (26 C) | 8 | 1.9 ft |
| Apr | 78 F (26 C) | 82 F (28 C) | 9 | 1.8 ft |
| May | 84 F (29 C) | 86 F (30 C) | 12 | 1.2 ft |
| Jun | 86 F (30 C) | 87 F (31 C) | 21 | 1.4 ft |
| Jul | 89 F (31 C) | 89 F (32 C) | 25 | 0.9 ft |
| Aug | 89 F (32 C) | 89 F (32 C) | 25 | 1.3 ft |
| Sep | 87 F (31 C) | 87 F (31 C) | 21 | 1.3 ft |
| Oct | 82 F (28 C) | 85 F (30 C) | 12 | 1.7 ft |
| Nov | 76 F (24 C) | 81 F (27 C) | 5 | 1.5 ft |
| Dec | 70 F (21 C) | 75 F (24 C) | 6 | 1.6 ft |
Explore Sand Dollar Spit Beach and Landing
Parking, food, stays, and facilities around the beach, mapped in OpenStreetMap within 0.7 mi.
All places near Sand Dollar Spit Beach and Landing as a list (17)
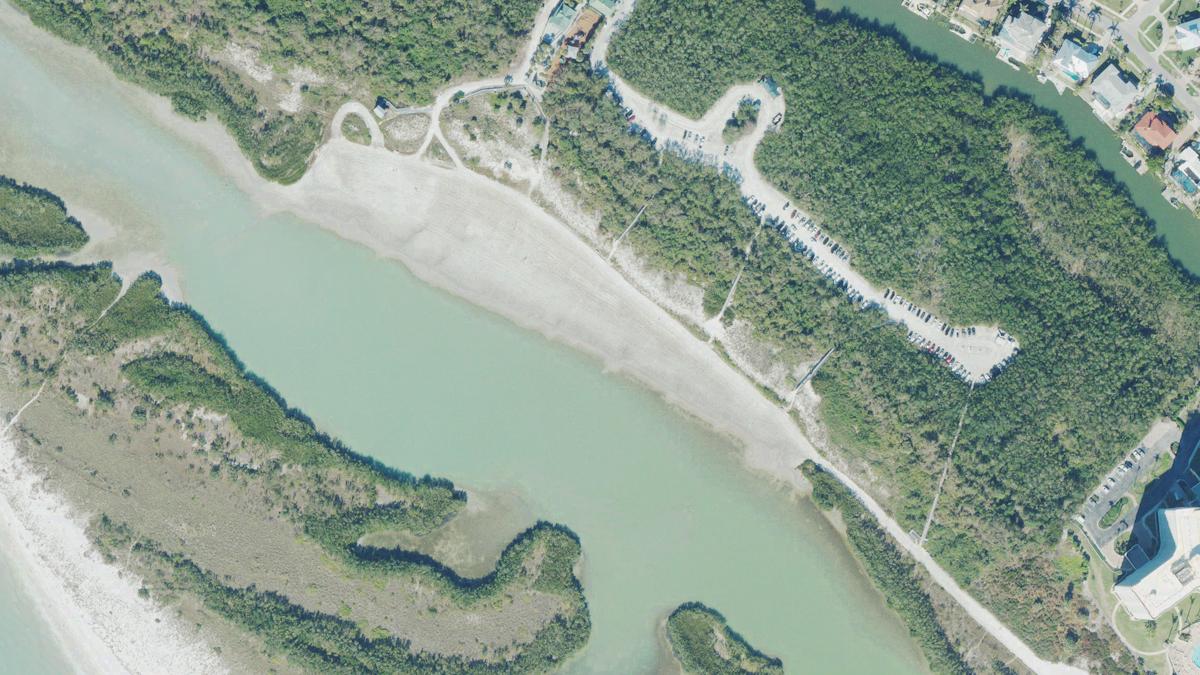
Beach access Main access and 2 more · Nearest parking 780 ft · 3 min walk · Nearest food and drinks 2,260 ft · 9 min walk · Nearest restrooms 1,570 ft · 6 min walk · Nearest showers 2,230 ft · 8 min walk
Nearby beaches
Questions about Sand Dollar Spit Beach and Landing
Is there parking at Sand Dollar Spit Beach and Landing?
Yes. 2 mapped parking areas within 1,310 ft. Source: OpenStreetMap.
How warm is the water at Sand Dollar Spit Beach and Landing?
Sea surface temperature averages 89 F (31 C) in July and 67 F (20 C) in January. Source: Open-Meteo marine model, monthly means.
Is the water calm at Sand Dollar Spit Beach and Landing?
Calm water scores 8.6 of 10. Mean daily maximum wave height is 1.5 ft. Source: Open-Meteo marine model.
Can you see the sunset over the water at Sand Dollar Spit Beach and Landing?
No. The shore faces away from the sunset all year.
When is hurricane season at Sand Dollar Spit Beach and Landing?
Atlantic hurricane season runs June 1 to November 30, with the peak from mid-August to late October, per the NOAA National Hurricane Center. Since 1980, 19 named storms passed within 62.1 mi of the beach, 8 at hurricane strength, most in August, September and October. Source: NOAA HURDAT2 best tracks.
Sources
- © OpenStreetMap contributors
- Weather data by Open-Meteo.com
- Storm tracks from the NOAA National Hurricane Center HURDAT2 archive, public domain
- Tide predictions from NOAA CO-OPS station Marco Island, Caxambas Pass (8724967), public domain
Licenses and refresh dates for every dataset are on the data page. Something wrong? Every beach page has a report button; corrections are logged with a date.
© OpenStreetMap contributors. Beach location, shoreline, and amenity positions are from OpenStreetMap under the ODbL. Data updated Sep 10, 2026.